Residual Map
residmap() calculates the
residual between smoothed data and model maps. Whereas a TS map is
only sensitive to positive deviations with respect to the model,
residmap() is sensitive to
both positive and negative residuals and therefore can be useful for
assessing the model goodness-of-fit. The significance of the
data/model residual at map position (i, j) is given by
where nk and mk are the data and model maps at energy plane k and fk is the convolution kernel. The convolution kernel is proportional to the counts expectation at a given pixel and normalized such that
where s is the expectation counts cube for a pure signal normalized to one.
Examples
The spatial and spectral properties of the convolution kernel are
defined with the model dictionary argument. All source models are
supported as well as a gaussian kernel (defined by setting
SpatialModel to Gaussian).
# Generate residual map for a Gaussian kernel with Index=2.0 and
# radius (R_68) of 0.3 degrees
model = {'Index' : 2.0,
         'SpatialModel' : 'Gaussian', 'SpatialWidth' : 0.3 }
maps = gta.residmap('fit1',model=model)

# Generate residual map for a power-law point source with Index=2.0 for
# E > 3.16 GeV
model = {'Index' : 2.0, 'SpatialModel' : 'PointSource'}
maps = gta.residmap('fit1_emin35',model=model,loge_bounds=[3.5,None])

# Generate residual maps for a power-law point source with Index=1.5, 2.0, and 2.5
model={'SpatialModel' : 'PointSource'}
maps = []
for index in [1.5,2.0,2.5]:
    model['Index'] = index
    maps += [gta.residmap('fit1',model=model)]
residmap() returns a maps
dictionary containing Map representations of the
residual significance and amplitude as well as the smoothed data and
model maps. The contents of the output dictionary are described in
the following table.
Key |
Type |
Description |
|---|---|---|
sigma |
Residual significance in sigma. |
|
excess |
Residual amplitude in counts. |
|
data |
Smoothed counts map. |
|
model |
Smoothed model map. |
|
files |
dict |
File paths of the FITS image files generated by this method. |
src_dict |
dict |
Source dictionary with the properties of the convolution kernel. |
The write_fits and write_npy options can used to write the
output to a FITS or numpy file. All output files are prepended with
the prefix argument.
Diagnostic plots can be generated by setting make_plots=True or by
passing the output dictionary to
make_residmap_plots:
maps = gta.residmap('fit1',model=model, make_plots=True)
gta.plotter.make_residmap_plots(maps, roi=gta.roi)
This will generate the following plots:
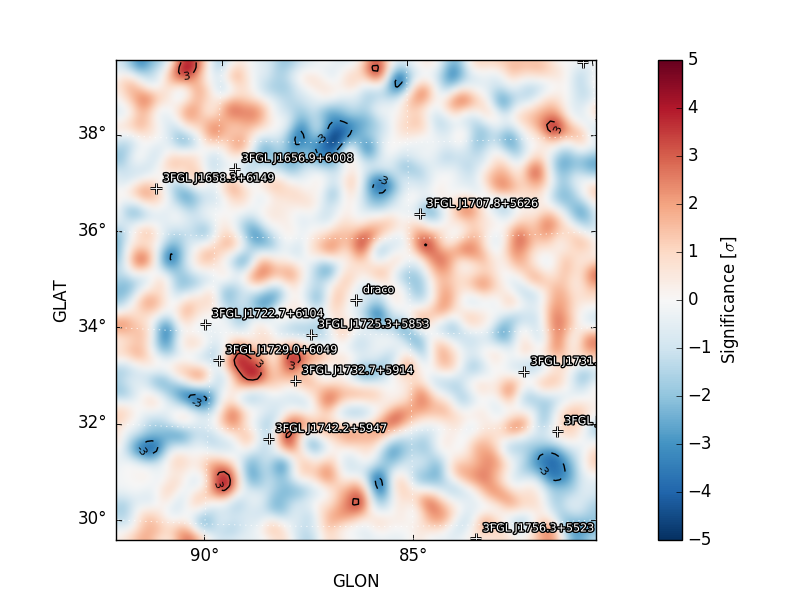
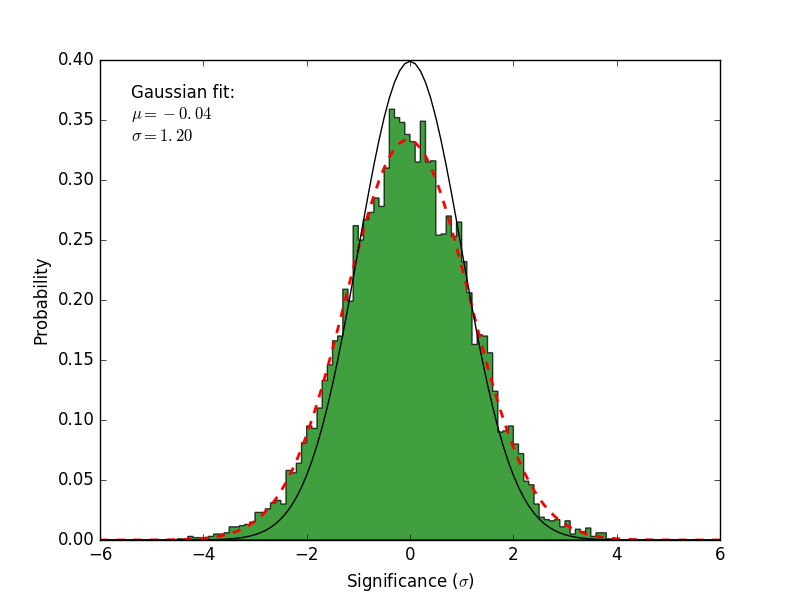
residmap_excess: Smoothed excess map (data-model).residmap_data: Smoothed data map.residmap_model: Smoothed model map.residmap_sigma: Map of residual significance. The color map is truncated at -5 and 5 sigma with labeled isocontours at 2 sigma intervals indicating values outside of this range.residmap_sigma_hist: Histogram of significance values for all points in the map. Overplotted are distributions for the best-fit Gaussian and a unit Gaussian.
Residual Significance Map |
Significance Histogram |
|---|---|
|
|
Configuration
The default configuration of the method is controlled with the residmap section of the configuration file. The default configuration can be overriden by passing the option as a kwargs argument to the method.
Option, Default, Description |
||
|---|---|---|
|
None |
List of sources that will be removed from the model when computing the residual map. |
|
None |
Restrict the analysis to an energy range (emin,emax) in log10(E/MeV) that is a subset of the analysis energy range. By default the full analysis energy range will be used. If either emin/emax are None then only an upper/lower bound on the energy range wil be applied. |
|
False |
Generate diagnostic plots. |
|
None |
Dictionary defining the spatial/spectral properties of the test source. If model is None the test source will be a PointSource with an Index 2 power-law spectrum. |
|
False |
Used weighted version of maps in making plots. |
|
True |
Write the output to a FITS file. |
|
True |
Write the output dictionary to a numpy file. |
Reference/API
- GTAnalysis.residmap(prefix='', **kwargs)
Generate 2-D spatial residual maps using the current ROI model and the convolution kernel defined with the
modelargument.